Stage Two of the Santos Tour Down Under was noticeably lumpier than the first stage. Here, we compare Pat Shaw’s first and final ascents of the hill into Stirling, noting that the race’s key moments are can be spotted in the rider’s data.
The ebb and flow of a stage and the way in which the peloton races can be seen clearly when comparing the data from a rider’s laps within that stage. For stage two of the Santos Tour Down Under, we are going to look at the data from Pat Shaw who is riding in his first TDU. Pat is a stalwart of domestic racing in Australia and has raced internationally for many years with Avanti IsoWhey Sport.
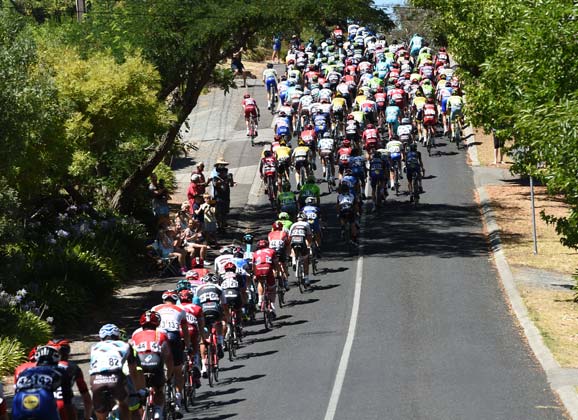
With great form, Pat earned his place in the UniSA team and has showed he is firing, with a top ten finish in the first stage and right up at the pointy end of proceedings towards the end of stage two. He has done all this while still looking after the team as the road captain. The first graph has been set up to show the altitude of the race and the first and final ascent of the Stirling stage. After the first small break containing Pat Lane had fought out for the KOM and the first sprint had been contested, Adam Hansen disappeared up the road. As in the previous day the peloton then settled down and the first climb of the Stirling loop was ridden at tempo and very controlled.

The first time up the climb was completed in 14 minutes and 42 seconds and an average speed of 29 km/h. Pat held a steady 254 watts (3.8 watts/kg). There were no big spikes in power and the peloton rode a steady tempo to maintain the gap to Hansen. Using the Today’s Plan 3D analytics graph and removing all the other lines of data you can see that Pat spent the highest percentage of his time between 280-289 watts and very little time above 400 watts.

In stark comparison, the final climb was ridden full gas as the teams jostled for position in the lead-up to the uphill sprint finish. By comparison the final climb was completed in just 11 minutes 28 seconds with an average speed of 36 km/h. Pat held 347 watts (5.3 watts/kg) up the climb as he followed the right wheels into the finish. By using the 3D graph we can toggle out early parts of the race and view only the final 20 minutes. The distribution of power is very different to the easy first time up the climb. Power distribution is spread into much higher zones as each team tried to take control at the front of the race.

The highest percentage of time was spent at 440-449 watts (6.9 watts/kg). The spread of data is very broad with lots of time spent hitting much higher power outputs (right up to 700 watts!). It is also possible to see the on/off nature of the final climb when the pace is changed as riders battled for wheels.
When comparing the two climb’s laps together this difference becomes very apparent and shows how the defining moments of a race are determined by the ability to hit huge numbers in repeated efforts and recover quickly.

In the end Pat narrowly avoided the Orica-GreenEdge crash which occurred right in front of him and had to hop onto the footpath, effectively ruining any chance of a top 10 finish.
This article originally appeared on ridemedia.com.au


